Contents
Marker Point Position Generator
METR4202 -- Lab I -- Due: August 27, 2014 Pick random integer locations from 1 to X/Y/Z in HLU
function PointList=Lab1RandLocations(NumberOfLocations, LegoMatSize)
Define Default System Variables
Enviroment/Lego Mat (x,y,z) = (width, length, height)
DefaultLegoMatSize=[10 6 5];
%  Pick SIX (6) Locations
DefaultNumberOfLocations=6;

% Switch based on number of input arguments
switch nargin
    case 0
        LegoMatSize=DefaultLegoMatSize;
        NumberOfLocations=DefaultNumberOfLocations;
    case 1
        LegoMatSize=DefaultLegoMatSize;
    otherwise
end

% Allocate Memory
MapGrid=zeros(LegoMatSize(2),LegoMatSize(1));
PointList=zeros(NumberOfLocations,3);
Get Random Positions
Pick X and Y done using randperm of the grid cells as randi might result in the same location being picked more than once
randcells=randperm(LegoMatSize(1)*LegoMatSize(2), NumberOfLocations);
% Add to the Map
MapGrid(randcells)=1;
% Add Planar Locations to Point List (rows are "Y" and columns are "X")
[PointList(:,2), PointList(:,1)]=find(MapGrid);
% Pick Z Hights Randomly
PointList(:,3)=randi(LegoMatSize(3), NumberOfLocations, 1);

%  Check for & fix shadowing by sorting the PointList: In this way if there
%  is shadowing in X, then we just sort the hieghts by Z so the highest is
%  at the furthest Y.
PointListSortXY=sortrows(PointList,[1,2]);
PointListSortXZ=sortrows(PointList,[1,3]);
PointList=[PointListSortXY(:,1:2), PointListSortXZ(:,3)];
Display Positions
Display the Point List
disp(PointList);
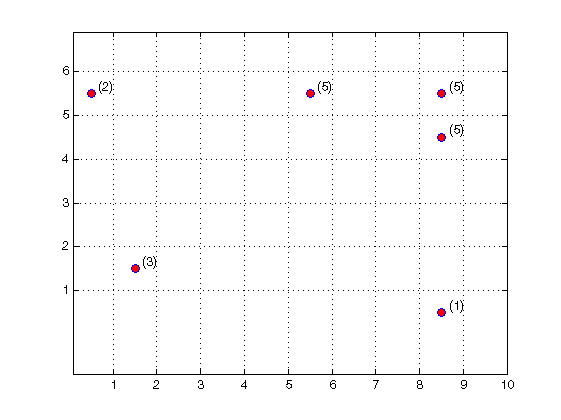
% Make a graph
figure(100+randi(100));
plot(PointList(:,1)-0.5, PointList(:,2)-0.5, 'Marker','o','MarkerFaceColor','red', 'LineStyle', 'none')
axis([0.1 LegoMatSize(1) 0.1 LegoMatSize(2)]);
set(gca,'XTick',1:LegoMatSize(1));
set(gca,'YTick',1:LegoMatSize(2));
axis equal;
grid on;
for ii=1:NumberOfLocations
    text(PointList(ii,1)-0.33, PointList(ii,2)-0.33, strcat('(',num2str(PointList(ii,3)), ')'));
end
     1     6     2
     2     2     3
     6     6     5
     9     1     1
     9     5     5
     9     6     5


ans =

     1     6     2
     2     2     3
     6     6     5
     9     1     1
     9     5     5
     9     6     5
